BART, three Contra Costa County Public Works projects also honored
By City of Antioch
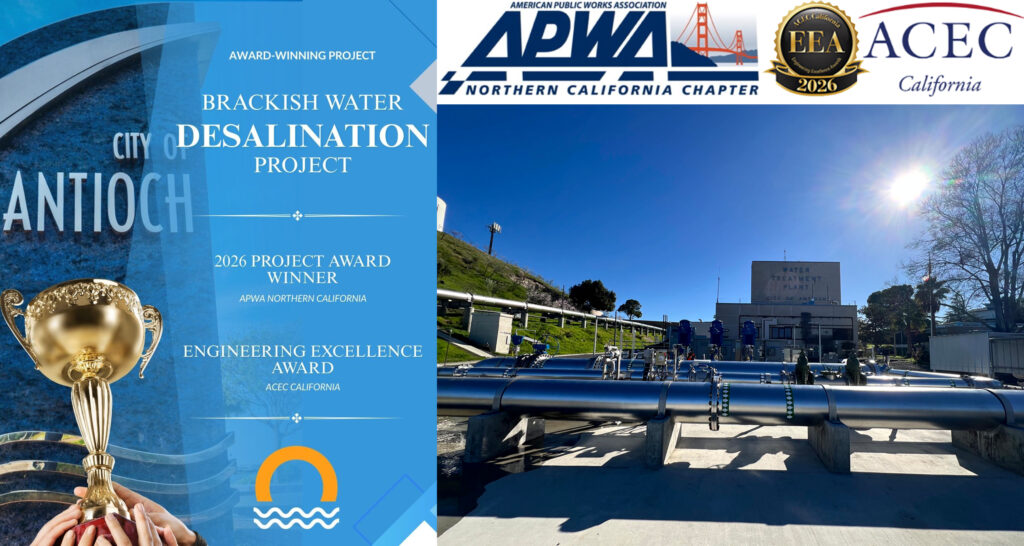
The City of Antioch’s Brackish Water Desalination Project continues to receive recognition across the engineering and public works community!
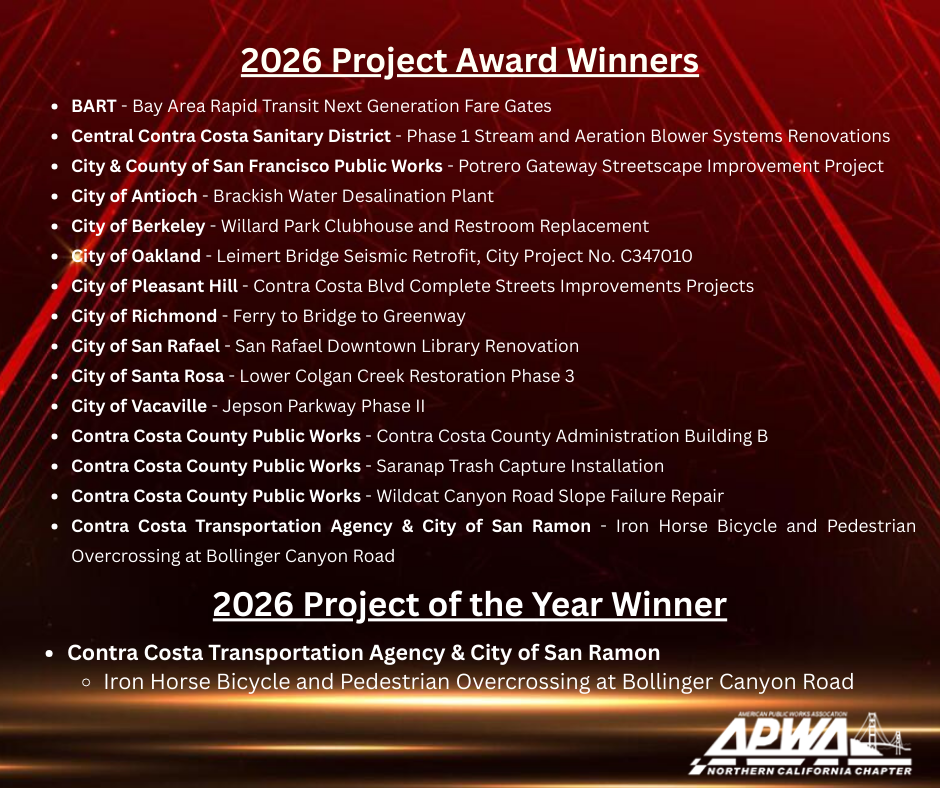
The project has been named a 2026 Project Award Winner by the American Public Works Association (APWA) Northern California Chapter. Antioch’s desal plant was one of eight projects in Contra Costa County, including three Public Works projects, honored at the 2026 Project Awards Luncheon in Vallejo on March 5th.
A total of 25 projects were nominated and 15 received an award, including BART and seven others in Contra Costa County. All winners will be moving on to the APWA National at Public Works Expo 2026 in Houston, TX in August for consideration.
Source: APWA Northern California
The APWA Northern California Chapter is a dynamic and engaged community of professionals dedicated to advancing the goals and mission of our association at the local level. The chapter is an integral part of the larger APWA network, representing a vibrant community of professionals in Northern California. We are committed to fostering professional growth, facilitating meaningful connections, and promoting excellence within the industry.
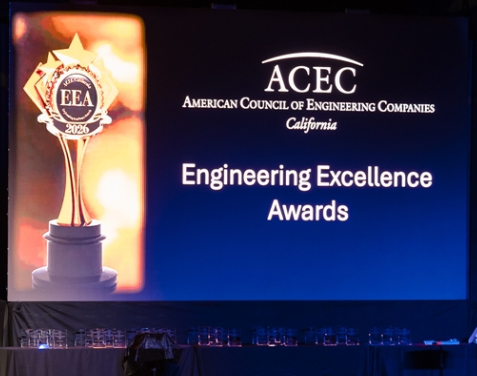
During the ACEC California awards ceremony on Feb. 19, 2026. Photo: ACEC California
ACEC California Engineering ExcellenceAward
Public Works Director Scott Buenting and Water Treatment Plant Superintendent Marcus Woodland were presented last month with an Engineering Excellence Award from the American Council of Engineering Companies of California (ACEC). Carollo Engineers of Walnut Creek submitted the Antioch project for consideration which received a ACEC California Merit Award.
The ACEC California’s annual Engineering Excellence Awards competition recognizes outstanding achievements in engineering and land surveying projects completed by California firms. Entries are accepted into one of 12 project categories: studies, research and consulting engineering services; building/technology systems; structural systems; surveying and mapping technology; environmental; waste and storm water; water resources; transportation; special projects; small projects; energy; and industrial and manufacturing processes and facilities.
Projects were recognized for demonstrating an exceptional degree of innovation, complexity, achievement, and value. Twenty projects earned the prestigious Honor Award distinction, twenty-seven were recognized with Merit Awards, and fifteen Commendation Awards were granted.
“We are proud to recognize these ACEC California firms for delivering an exceptional degree of value and technical excellence to our communities,” said Tyler Munzing, Executive Director of ACEC California. “Quality infrastructure—from dependable drinking water to safe, efficient roadways and structurally sound public spaces—is essential to our state’s success. These award-winning projects showcase how our engineering and land surveying firms are passionately building a more resilient and connected California.”
The awards were announced at the Engineering Excellence Awards Banquet on February 19, 2026. The annual celebration is also a fundraiser for the ACEC California Scholarship Foundation 501(c)3, which provides scholarship awards to graduate and undergraduate students who are recognized for their notable and outstanding academic achievements.
These recognitions highlight the expertise and dedication of the team working to deliver safe, reliable water for our community.
Over $107 million for Contra Costa projects including $46.9 million on Hwy 4 from Hillcrest Avenue in Antioch to Byron Highway near Brentwood
By Edward Barrera, Division Chief, Caltrans Public Affairs
In August, the California Transportation Commission (CTC) approved $3 billion in allocations to enhance safety and mobility across the state highway system and expand multimodal travel, including bike lanes and pedestrian pathways. Guided by Governor Gavin Newsom’s Build More, Faster – For All infrastructure agenda, these improvements will make California communities safer, cleaner and increase access to active transportation options.
Of the $3 billion allocated, $663 million derives from Senate Bill (SB) 1, the Road Repair and Accountability Act of 2017 and approximately $2 billion from the federal Infrastructure Investment and Jobs Act of 2021 (IIJA). The funds will serve as a catalyst to increase the capacity of the state’s transportation system, rehabilitate aging roadways and improve travel times, while balancing community impacts and promoting environmental benefits.
The “…investments reflect California’s long-term commitment to safer roads, smarter traffic management and expanded transportation choices that get people where they need to go,” said Caltrans Director Dina El-Tawansy.
“The funds allocated…reflect the Commission’s commitment to investing taxpayer dollars strategically. These investments will improve the safety and reliability of the state’s transportation network and support a thriving economy by improving the movement of freight and reducing out-of-pocket expenses for all California,” said Darnell Grisby, Chair of the California Transportation Commission.
Projects in Contra Costa County approved by the Commission include:
$46,900,000 on SR-4 in and near Antioch and Brentwood, from Hillcrest Avenue to Byron Highway, to rehabilitate pavement and drainage systems, upgrade facilities to ADA standards, install Accessible Pedestrian Signals (APS), high-visibility crosswalks, bike loop detectors, and construct Class II bike lanes. This will extend pavement service life and improve ride quality.
$42,374,000 on I-680 in San Ramon and Danville, from Alcosta Boulevard to 0.1 mile north of Diablo Road, to rehabilitate pavement, upgrade guardrail, and upgrade facilities to ADA standards. This will extend pavement service life and improve ride quality.
$14,584,000 on SR-24 in Orinda, at the Caldecott Tunnel, to rehabilitate and upgrade the ventilation system in Bores 1, 2, and 3. This will ensure structural integrity and prolong tunnel service life.
$1,301,000 on SR-4 in Concord, 0.5 mile east of Port Chicago Highway, to reconstruct a failed slope embankment and repair a displaced down drain due to heavy rainfall in February and March 2025. Work includes installing Rock Slope Protection (RSP), and repairing the down drain, guardrail, and dike. This will enhance driver and pedestrian safety.
• $1,275,000 on SR-4 near Pittsburg, 0.3 mile west of Bailey Road, to reconstruct a slope embankment and repair a displaced down drain due to heavy rainfall in February and March 2025. Work includes installing Rock Slope Protection (RSP). This will improve roadway safety.
$999,000 on SR-24 in Lafayette, from 0.7 to 1.0 mile east of Acalanes Road, to rehabilitate pavement due to ponding and water seepage caused by heavy rainfall in February and March 2025, which led to cracking and settlement. This will extend pavement life and improve safety.
IIJA is a once-in-a-generation investment in our nation’s infrastructure to improve the sustainability and resiliency of our country’s energy, water, broadband and transportation systems. The total funding for California is nearly $54 billion. This includes investments to upgrade the state’s roads, bridges, rail, public transit, airports, ports, waterways and the electric vehicle charging network.
SB 1 has invested approximately $5 billion annually toward transportation projects since its adoption. It provides funding split between the state and local agencies. Road projects progress through construction phases more quickly, based on the availability of funds, including those partially funded by SB 1.
Visit build.ca.gov to learn more about transformative infrastructure projects happening in communities throughout the state.
Existing transportation funding strained by rising construction costs, population growth, potential decrease in state gas tax revenue
“115 of 1,374 bridges are rated poor/structurally deficient, with significant deterioration” – TRIP Report
By Carolyn Bonifas Kelly, Director of Communication & Research, TRIP
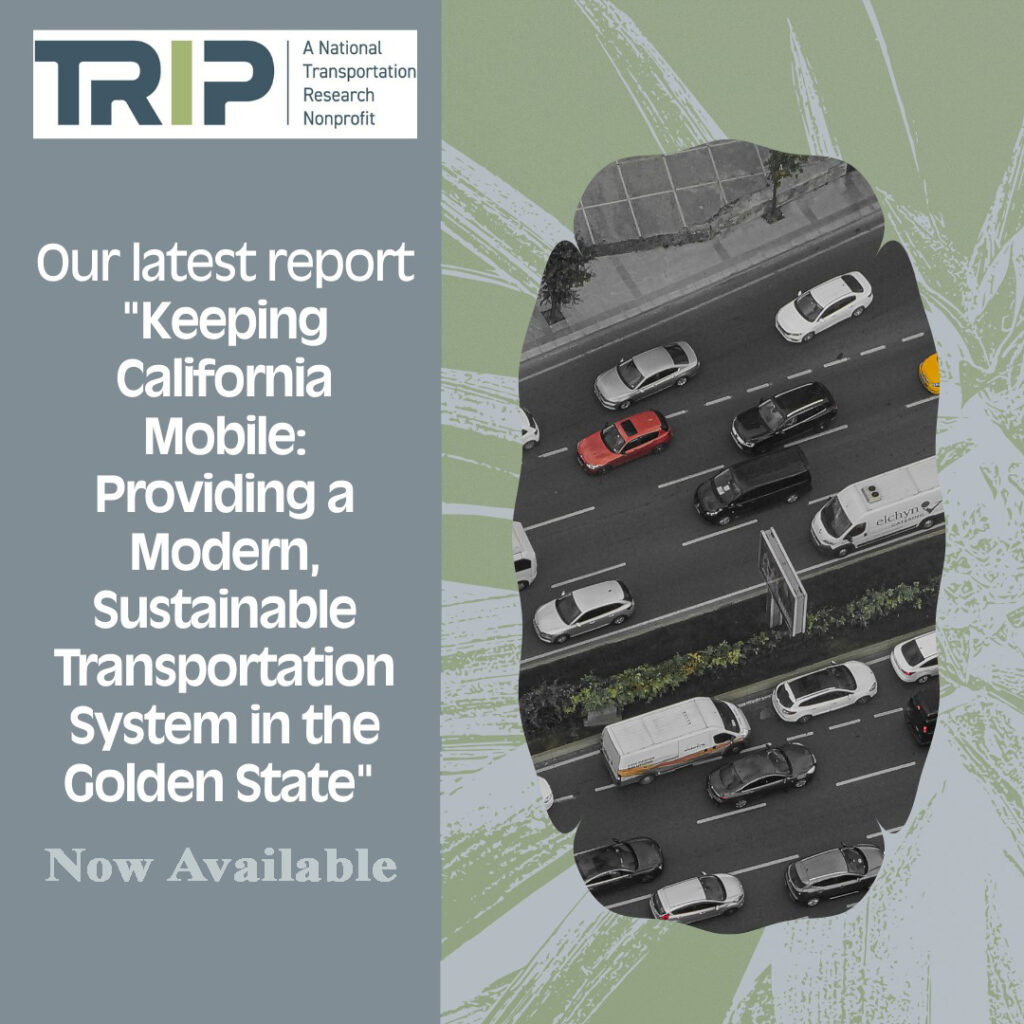
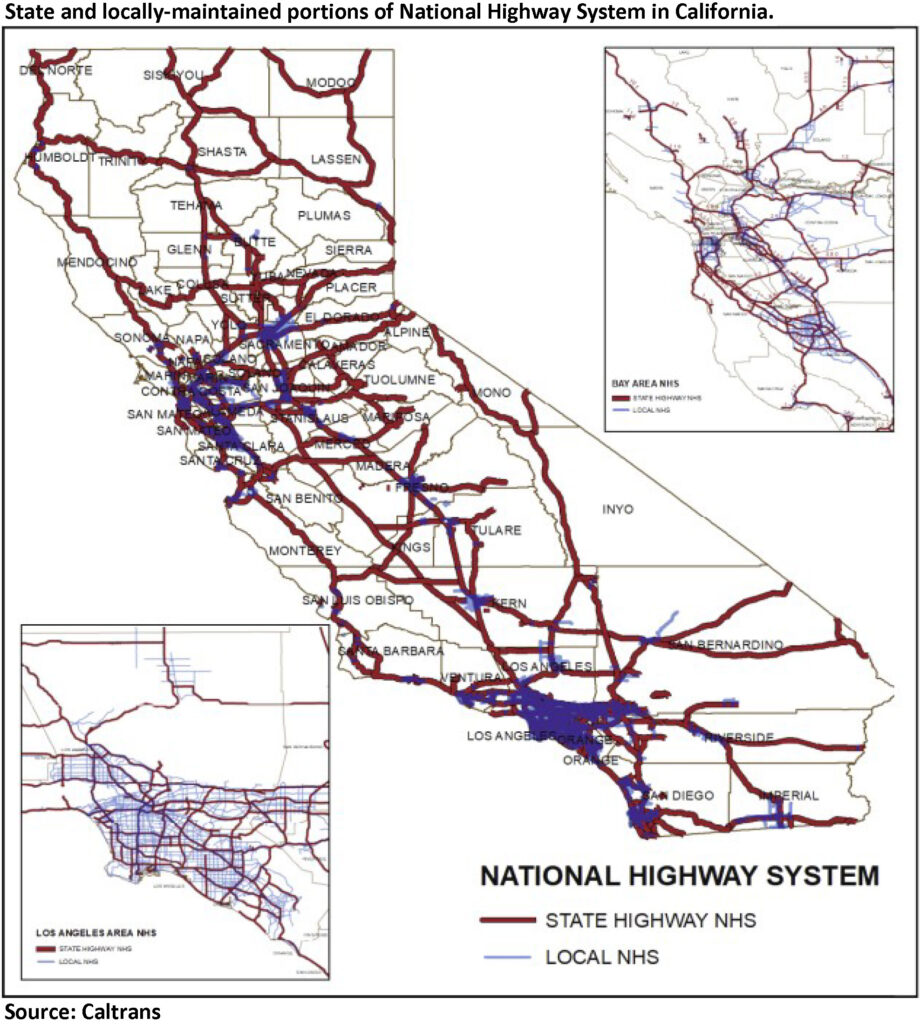
San Francisco, CA – While additional state and federal transportation funding is allowing California to repair and improve roads and bridges, a new report documents looming challenges including population growth, rising congestion, construction cost inflation and declining fuel-tax revenue. The report by The Road Information Program, TRIP, a national transportation research nonprofit based in Washington, DC, examines California’s road and bridge conditions, congestion and reliability, highway safety, economic development, vehicle travel trends, and the impact of recent state and federal transportation funding increases.
The TRIP report, “Keeping California Mobile: Providing a Modern, Sustainable Transportation System in the Golden State,” finds that throughout the state, traffic fatalities have increased significantly in the last decade despite recent downward trends, 50 percent of major roads are in poor or mediocre condition, five percent of locally and state-maintained bridges (20 feet or more in length) are rated poor/structurally deficient, and traffic congestion costs the state’s drivers $55 billion annually in lost time and wasted fuel. In addition to statewide data, the TRIP report includes regional pavement and bridge conditions, congestion data, highway safety data, and cost breakdowns for the Los Angeles, Riverside-San Bernardino, Sacramento, San Diego, San Francisco-Oakland and San Jose urban areas.
The TRIP report finds that 73 percent of major locally and state-maintained roads in the San Francisco-Oakland urban area are in poor or mediocre condition, costing the average motorist an additional $1,106 each year in extra vehicle operating costs, including accelerated vehicle depreciation, additional repair costs, and increased fuel consumption and tire wear. Statewide, 28 percent of California’s major roads are in poor condition and 22 percent are in mediocre condition. TRIP estimates that the state’s drivers lose $24.2 billion annually in extra vehicle operating costs as a result of driving on deteriorated roads.
In the San Francisco-Oakland area, eight percent of bridges (115 of 1,374 bridges) are rated poor/structurally deficient, with significant deterioration to the bridge deck, supports or other major components. This includes locally and state-maintained bridges that are 20 feet or longer. Statewide, five percent of California’s bridges are rated poor/structurally deficient. Most bridges are designed to last 50 years before major overhaul or replacement. In California, 54 percent of the state’s bridges were built in 1969 or earlier.
According to the TRIP report, traffic congestion in the San Francisco-Oakland area causes 111 annual hours of delay for the average motorist and costs the average driver $3,406 annually in lost time and wasted fuel. On average, San Francisco-Oakland drivers waste 38 gallons of fuel annually due to congestion. Statewide, drivers lose $55 billion annually because of lost time and wasted fuel due to traffic congestion. Due to the Covid-19 pandemic, vehicle travel in California dropped by as much as 41 percent in April 2020 (as compared to vehicle travel during the same month the previous year).By 2025, vehicle miles of travel in California had rebounded to five percent below 2019’s pre-pandemic levels. Congestion reduces job accessibility significantly. In California’s six largest metros, the number of jobs accessible within a 40-minute drive during peak hours were reduced by 44 percent in 2023 as a result of traffic congestion.
Source: TRIP
Traffic crashes in California claimed the lives of 24,508 people from 2019 to 2024. The state’s 2024 traffic fatality rate of 1.19 fatalities for every 100 million miles traveled was slightly lower than the national average of 1.2. The number of traffic fatalities and the fatality rate per 100 million vehicle miles of travel in California spiked dramatically in 2020 and 2021 before falling each year from 2022 to 2024. But, despite recent progress, from 2014 to 2024 the number of traffic fatalities in California increased 24 percent and the state’s traffic fatality rate increased 29 percent. From 2019 to 2023, 30 percent of those killed in California crashes involving motorized vehicles were pedestrians or bicyclists. In the San Francisco-Oakland area, 36 percent of traffic fatalities between 2019 and 2023 (306 of 934) were pedestrians or bicyclists.
“California’s future depends on transportation infrastructure that can withstand the challenges of a changing climate and a growing population,” said Senator Dave Cortese, chair of the California Senate Transportation Committee. “These investments don’t just move people and goods—they cut emissions, strengthen communities, create jobs, and spur economic growth. The TRIP report makes clear that smart infrastructure investments are among the most powerful tools we have to support California’s workforce and drive long-term economic prosperity.”
Improvements to California’s roads, highways and bridges are funded by local, state and federal governments. In April 2017, the California legislature enacted SB 1 — the Road Repair and Accountability Act. SB 1 increased state revenues for transportation by increasing the state’s gasoline and diesel taxes, implementing a transportation investment fee on vehicles and initiating an annual fee on zero emission vehicles. SB 1 is estimated to increase state revenues for California’s transportation system by an average of $5.2 billion annually through to 2027. In addition to state transportation funding, the Infrastructure Investment and Jobs Act (IIJA), signed into law on November 2021, provides $25.3 billion in federal funds to the state for highway and bridge investments in California over five years, representing a 29 percent increase in annual federal funding for roads and bridges in the state over the previous federal surface transportation program. The IIJA is set to expire on September 30, 2026.
“California’s transportation system is the backbone of our daily lives, connecting millions of people to work, school, and opportunity,” said Assemblymember Lori Wilson, chair of the California State Assembly Transportation Committee. “The TRIP report provides the proof points behind what we already know: our infrastructure needs are urgent and growing. As we transition to cleaner vehicles and more sustainable mobility, we must secure fair and reliable funding solutions to ensure tomorrow’s infrastructure serves Californians better than today’s.”
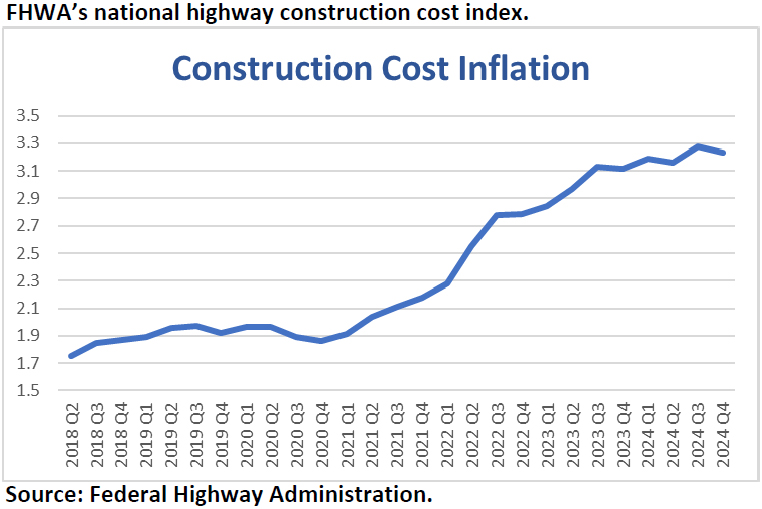
The ability of revenue from California’s motor fuel tax – a critical source of state transportation funds – to keep pace with the state’s future transportation needs is likely to erode as a result of increasing vehicle fuel efficiency, the increasing use of electric vehicles and inflation in highway construction costs. The Federal Highway Administration’s national highway construction cost index, which measures labor and materials cost, increased by 48 percent from the beginning of 2022 through the fourth quarter of 2024.
The California Legislative Analyst’s Office (LAO) found that steps taken by California to reduce greenhouse gas emissions, including programs and policies that are targeted at increasing the adoption of zero-emission vehicles (ZEVs), increasing the use of lower-carbon fuels, and reducing the number of vehicle miles traveled will reduce state transportation revenues by $4.4 billion over the next decade. This reduction in state transportation spending which is projected to result in poorer road conditions. However, the recent federal rollbacks to California strict emissions requirements will impact these programs and policies.
“Our deteriorating transportation system costs Californians lives, time, and money,” said California Transportation Commissioner Joseph Cruz. “Every investment in improving and maintaining our roads, bridges, and transit networks is an investment in people. These projects don’t just build infrastructure – they create good jobs, support local economies, and ensure California’s workforce is at the center of the solution.”
Source: TRIP
The efficiency and condition of California’s transportation system, particularly its highways, is critical to the health of the state’s economy. In 2023 California’s freight system moved 1.4 billion tons of freight, valued at $2.8 trillion. From 2022 to 2050, freight moved annually in California by trucks is expected to increase 65 percent by weight and 100 percent by value (inflation-adjusted dollars). The design, construction and maintenance of transportation infrastructure in California supports approximately 420,000 full-time jobs across all sectors of the state economy. Approximately 7.1 million full-time jobs in California in key industries like tourism, retail sales, agriculture and manufacturing are dependent on the quality, safety and reliability of the state’s transportation infrastructure network.
“California’s transportation dollars are already being stretched thin by increased inflation in construction costs and declining fuel tax revenue,” said Dave Kearby, TRIP’s executive director. “Without additional transportation investment, needed projects that would make the state’s roads safer, smoother and more efficient will not move forward.”
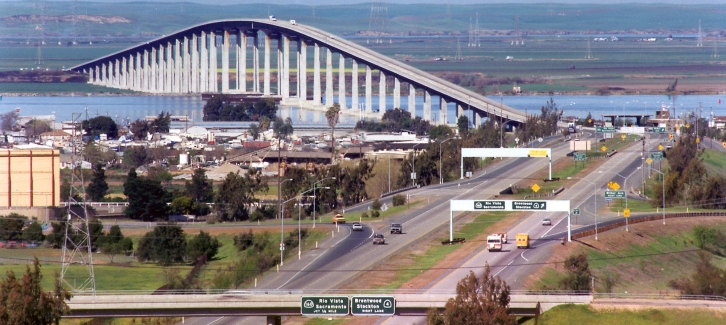
Contra Costa County— Caltrans’ scheduled one-way traffic control on the Antioch John A. Nejedly Bridge (SR-160) to continue Monday March 17th from 7 a.m. until 2 p.m.
Southbound SR-160 from the North End of the bridge to the Antioch Toll Plaza will be closed daily from from March 17-21, 2025. Traffic will be able to flow Southbound in the Northbound Lane when clear by flaggers holding traffic coming Northbound at the South End of the Bridge. The closure will extend the entire length of the bridge.
A pilot car will be implemented and the speed will be restricted to 25 mph in the work zone.
Caltrans will turn on Changeable Message Signs (CMS) to notify the public ahead of time. For real-time traffic, click on Caltrans QuickMap: http://quickmap.dot.ca.gov/
Eastbound and westbound views of the now open Sand Creek Road Extension including the bridge over the creek. Herald file photos.
Connects Heidorn Ranch Road and Hillcrest Avenue in Antioch to Hwy 4
By Allen D. Payton
The City of Brentwood announced on Monday, “The Sand Creek Road Extension is NOW OPEN! We’re thrilled to bring this new roadway to the community and hope it enhances your travels. Please drive safely and enjoy the new route!”
About the delay in the road’s opening two weeks after the ribbon cutting, Assistant City Manager Darin Gale said, “The extension is a unique project because it starts at an intersection that’s controlled by Caltrans and ends at an intersection that’s controlled by Antioch.”
“There were still some items that needed to be completed before we could open the road,” he shared, reiterating what City Manager Tim Ogden said during the ribbon cutting ceremony on Jan. 28. (See related article)
“We appreciate the partnership with those two agencies in getting the road open as quickly as possible” Gale added.
“Part of the intersection built by the developer in Antioch had not yet been approved by the City of Antioch,” he explained as one of the reasons for the delay.
Aerial view of the Sand Creek Road Extension at Heidorn Ranch Road. Source: City of Brentwood
Gale was asked about the timing of the opening and if it had anything to do with the new Costco opening nearby.
He responded, “The City of Brentwood was moving forward with the Sand Creek Road anyway. However, the road does provide a connection to Costco. While it was coincidental to the timing of the opening of Costco, it helped us with attracting the store to Brentwood.”
“We look forward to Sand Creek Road serving the Brentwood Innovation Center (located to the north) and bringing jobs to the residents of East County,” Gale stated.
The new section of the road now connects to the Antioch section at Heidorn Ranch Road, then to Hillcrest Avenue and west to the road that runs north adjacent to Dozier Libbey Medical High School in Antioch.
Gale also reiterated what Antioch Mayor Ron Bernal said at the ribbon cutting, as previously reported. He said, “Richland Communities over to the west of us, they’re going to be starting this year, I’m told, on their subdivision that’s going to build that final link between Sand Creek Road, where it terminates right now, and Deer Valley Road. So, that’s going to be able to get residents and folks over to Kaiser, which is important, getting people off of Deer Valley Road.”
Sand Creek Road will eventually connect to Dallas Ranch Road in Antioch, on the west side of Deer Valley Road and run through The Ranch 1,177-new home subdivision developed by Richland Communities and approved by the Antioch City Council in July 2020.
For $2 billion in maintenance, preservation and operation of Bay Area’s seven state-owned bridges.
Contra Costa’s representatives voted in favor of 50-cent annual increases beginning Jan. 1, 2026.
By Allen D. Payton
After extending the period for public input, on Wednesday, Dec. 18, 2024, the Bay Area Toll Authority (BATA) Board of Directors voted 15-0-1 to approve toll increases and other toll policy changes for the Bay Area’s seven state-owned bridges beginning Jan. 1, 2026. Tolls will increase to as much as $11.50 by 2030.
According to BATA spokesman John Goodwin, the vote passed “by all 16 members present save one abstention from a brand-new commissioner, Alameda Mayor Marilyn Ezzy-Ashcraft, who represents the cities of Alameda County.”
The board consists of 21 members, with 18 voting members, he shared. Pleasant Hill Mayor Sue Noack, who represents the cities of Contra Costa, and Contra Costa District 5 Supervisor Federal Glover, who represents the County, both voted in favor of the toll increases.
A phased toll increase starting in 2026 is proposed to fund the Toll Bridge Capital Improvement Plan, which includes almost $2 billion of investment which will be used exclusively for the maintenance, preservation and operation of the San Francisco-Oakland Bay Bridge and the Antioch, Benicia-Martinez, Richmond-San Rafael, Carquinez, Dumbarton and San Mateo-Hayward bridges.
The Bay Area’s seven state-owned toll bridges are structurally sound and in good repair. State law requires BATA — working in partnership with Caltrans — to keep them that way.
The toll increases are separate from the $3 increase approved by Bay Area voters in 2018 through Regional Measure 3 to finance a comprehensive suite of highway and transit improvements around the region. The first of the three $1 Regional Measure 3 increases went into effect in 2019, followed by another in 2022. The last of the RM 3 toll hikes will go into effect Jan. 1, 2025, bringing the toll for regular two-axle cars and trucks to $8.
Summary of the 2026 Toll Increase
Toll rates include the last voter-approved Regional Measure 3 (RM 3) toll increase that goes into effect January 1, 2025.
To encourage electronic toll payment with FasTrak® tags, tolls and help recoup the increased costs of collecting tolls via pre-registered license plate accounts or invoices, on Jan. 1, 2027 will also rise by 25 cents for customers who pay with a pre-registered license plate account and on January 1, 2027, will rise by $1 for tolls paid by invoice.
Two-Axle Vehicle Toll increase schedule 2026-30. Source: BATA
Toll Increase: Two-Axle Vehicle Toll
The toll rate update includes an increase of 50 cents a year from 2026 through 2030 for two-axle vehicles. This phased-in approach is similar to the Golden Gate Bridge’s recent multi-year update to its toll schedule.
*HOV rate is 50% of two-axle FasTrak rate.
Three-Axle or More Vehicle Toll increase schedule 2026-30. Source: BATA
Toll Increase: Three-Axle or More Vehicle Toll
Tolls for multi-axle vehicles also will rise by 50 cents per axle per year from 2026 through 2030.
Multi-axle differential pricing:
Invoices: +$1.00 per transaction starting January 1, 2027
License plate account: + $0.25 per transaction starting January 1, 2027
A Precedent for Tiered Pricing
The Golden Gate Bridge, Highway and Transportation District has used a tiered pricing schedule at the Golden Gate Bridge since 2014.
Golden Gate Bridge tolls by July 2028 will range from $11.25 for FasTrak to $11.50 for license plate accounts to $12.25 for invoice customers.
Summary of the Changes to High-Occupancy Vehicle (HOV) Policies
BATA is also making changes to HOV policies. To provide regional consistency and to support the future deployment of open-road tolling at the state-owned bridges, the changes will establish a uniform three-person occupancy requirement for the discounted toll during weekday commute periods at all seven bridges. It will also allow vehicles with two occupants to use the carpool lanes on the approaches to all bridges except the San Francisco-Oakland Bay Bridge. These two-occupant vehicles will not receive the discounted toll but will be able to use the carpool lanes to save time traveling through the toll plazas.
BATA’s existing toll schedule allows vehicles with three or more occupants (HOV 3+) a discounted toll (half-price), with a two-person (HOV 2+) occupancy requirement for the discounted tolls at the Dumbarton and San Mateo-Hayward bridges. To provide regional consistency and to support the future deployment of open-road tolling at the state-owned bridges, the new policy will establish a uniform three-person occupancy requirement for the discounted toll during weekday commute periods at all seven bridges. The discounted toll rate is available weekdays from 5 to 10 a.m. and from 3 to 7 p.m.
The policy changes will also allow vehicles with two occupants to use the carpool lanes on the approaches to the Antioch, Benicia-Martinez, Carquinez, Dumbarton, Richmond-San Rafael and San Mateo-Hayward bridges. These two-occupant vehicles will not receive the discounted toll but will be able to use the carpool lanes to save time traveling through the toll plazas. There will be no change at the San Francisco-Oakland Bay Bridge, where volumes of vehicles with three or more occupants are much higher than those at other bridges. Use of the carpool lanes on approaches to the Bay Bridge will still require a minimum of three occupants.
In addition to establishing region-wide consistency for the carpool toll discount, the policy changes are designed to:
Improve safety on the toll bridge approaches by minimizing “weaving” between lanes.
Optimize lane configurations as now-obsolete toll booths are removed as part of the bridges’ transition to open-road tolling.
Increase person-throughput by prioritizing access for buses and carpools.
The John A. Nejedly Bridge in Antioch. Photo: BATA
By Marc Joffe
As if the $1 toll hike on January 1, 2025, is not enough, commissioners at the Bay Area Toll Authority (BATA) plan to approve a series of five fifty cent increases starting in 2026. By 2030, tolls on the Bay Area’s seven state-owned bridges will reach $10.50 for FasTrak users and $11.50 for drivers paying by invoice. Included in the increase are these four bridges with landings in Contra Costa County:
Antioch (Senator John A. Nejedly) Bridge
Benicia-Martinez (George Miller) Bridge
Carquinez Bridge
Richmond-San Rafael Bridge
Aside from toll hikes, motorists are facing a gasoline price increase arising from the California Air Resources Board’s recent imposition of the Low Carbon Fuel Standard. According to a research center at the University of Pennsylvania, LCFS could cost drivers up to 85 cents extra per gallon. And this is on top of California’s highly elevated fuel prices, driven by taxes that rise annually under SB1 (2018).
Despite increasing maintenance costs, the Bay Area bridges are quite profitable. BATA expects total revenue of $1.058 billion this year. The costs of operating the bridges, running FasTrak, and paying debt service are projected to total just $757 million, leaving $300 million to spare.
As BATA admits in its own FAQ on the toll increase, $3.00 of the current $7.00 toll is already being siphoned off for purposes other than bridge operations, maintenance, and seismic safety (this will increase to $4.00 of $8.00 on January 1). For example, almost $6 million is diverted annually to the Transbay Joint Powers Authority to operate its empty bus terminal and to pursue its hopeless plan to bring high-speed rail trains into the Salesforce Transit Center. Bridge toll money is also being used to subsidize Bay Area ferries, SF Muni, AC Transit, Golden Gate Transit, and the NAPA Vine bus service.
The toll hike on the Antioch Bridge is especially egregious. BATA is charging the same tolls on all its bridges despite their vastly different lengths. The Bay Bridge is 8.4 miles long while the Antioch Bridge is just 1.8 miles long. Also, unlike all other Bay Area bridges, the Antioch Bridge has just one lane in each direction.
And then there is the question of income. While many Bay Area drivers are wealthy enough to easily absorb the toll hike, that is less true of people living near the Antioch Bridge. According to Census Reporter, Antioch’s per capita income is only 56 percent of the average for the San Francisco-Oakland-Fremont metro region. Rio Vista, the first sizable community on the north side of the bridge, clocks in at just 67 percent of the metro area’s income per person.
At minimum, BATA should exempt the Antioch Bridge from its planned toll hikes. But better yet, the Authority should shelve its entire toll increase plan, stop siphoning off toll money for other purposes, and live within its means.
Marc Joffe is President of the Contra Costa Taxpayers Association.
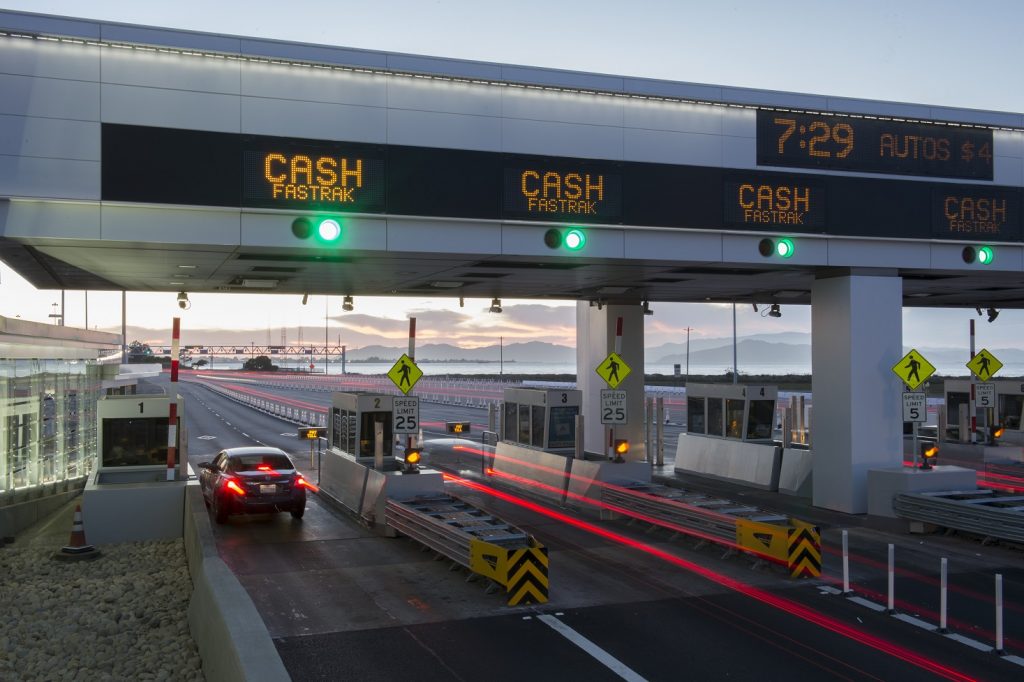
Bay Bridge Toll Plaza photos taken 9 /16 & 8/13. By Karl Nielsen courtesy of MTC
Until Dec. 18
Board considering increasing to as high as $11.50 to pay “exclusively for bridge preservation and operations” in spite of three voter-approved $1 increases
“A Thanksgiving/holiday season decision is a hide the ball strategy. Not good.” – State Senator Steve Glazer
By John Goodwin & Rebecca Long, MTC
November 20, 2024 update: The public comment period on the Bay Area Toll Authority’s proposed toll increase and HOV policy changes is extended through the end of public comment heard on the agenda item for BATA’s December 18, 2024 meeting. All public written and oral comments provided through that time will be incorporated into the record. However, in order for comments to be summarized and published in the agenda packet and distributed in advance of consideration of this item at the December 11, 2024, BATA Oversight Committee meeting, they must be submitted by 5 p.m. December 3, 2024.
BATA — which is required by state law to fund projects to preserve and protect the Bay Area’s seven state-owned toll bridges — today heard again a proposal for a toll increase that would be used only to pay for the maintenance, rehabilitation and operation of the San Francisco-Oakland Bay Bridge and the Antioch, Benicia-Martinez, Carquinez, Dumbarton, Richmond-San Rafael and San Mateo-Hayward bridges. If approved by BATA at its December 18 meeting, the toll increase would be phased in over five years, beginning Jan. 1, 2026.
Source: BATA
The toll increase proposal includes a tiered rate structure aimed at encouraging more customers to pay electronically with FasTrak® toll tags, as this form of payment carries lower administrative costs than payment through a license plate account or returning payment with an invoice received by mail. Under the proposal, customers would pay a premium for using a pre-registered license plate account or for invoiced tolling. To give customers ample time to sign up for FasTrak, this premium would not begin until 2027.
The proposed toll hike is separate from the $3 increase approved by Bay Area voters in 2018 through Regional Measure 3 to finance a comprehensive suite of highway and transit improvements around the region. The first of the three $1 Regional Measure 3 toll increases went into effect in 2019, followed by another in 2022. The last of the RM 3 toll hikes will go into effect Jan. 1, 2025, bringing the toll for regular two-axle cars and trucks to $8.
The proposal heard today by BATA calls for tolls for all regular two-axle cars and trucks to increase to $8.50 on Jan. 1, 2026. Tolls for customers who pay with FasTrak tags would then rise to $9 in 2027; to $9.50 in 2028; to $10 in 2029; and then to $10.50 in 2030. Tolls for customers who use a pre-registered license plate account would rise to $9.25 in 2027; to $9.75 in 2028; to $10.25 in 2029 and to $10.75 in 2030. Invoiced tolls would rise to $10 in 2027; $10.50 in 2028; $11 in 2029; and $11.50 in 2030. The Golden Gate Bridge has used a tiered pricing schedule since 2014. Golden Gate Bridge tolls by July 2028 will range from $11.25 for FasTrak to $11.50 for license plate accounts to $12.25 for invoice customers.
Source: BATA
Under the proposed toll increase, tolls for large freight trucks and other vehicle/trailer combinations with three or more axles would rise by 50 cents per axle each year from 2026 through 2030.
“I’m sensitive to the overall cost of living in the Bay Area,” acknowledged Napa County Supervisor Alfredo Pedroza, who also serves as chair of both BATA and the Metropolitan Transportation Commission (MTC). “Working families really feel the impact, not just in transportation but back at home with utilities, groceries, children. This one is hard. But it’s the right thing to do.”
BATA and MTC invite members of the public to weigh in on the proposed toll increase during a comment period that begins Monday, Nov.4, and continues through the end of BATA’s Dec. 18 meeting. Comments may be sent via email to info@bayareametro.gov. As part of its regular November meeting, BATA today held a public hearing in San Francisco to receive testimony about the proposal from Bay Area residents, businesses and other interested parties.
Today’s presentation by BATA and MTC staff also proposed updates to the policies for high-occupancy vehicles on approaches to the Bay Area’s state-owned toll bridges. These updates would take effect Jan. 1, 2026, concurrent with the proposed toll increase. BATA’s existing toll schedule allows vehicles with three or more occupants (HOV 3+) a discounted toll, with a two-person (HOV 2) occupancy requirement for half-price tolls at the Dumbarton and San Mateo-Hayward bridges. BATA and MTC staff propose to establish a uniform three-person occupancy requirement for half-price tolls during weekday commute periods at all seven bridges. Carpool vehicles at all state-owned bridges must use a dedicated carpool lane and pay their tolls with a FasTrak Flex toll tag set to the ‘3’ position to receive the 50 percent discount available weekdays from 5 a.m. to 10 a.m. and from 3 p.m. to 7 p.m.
The proposed carpool policy changes also would allow vehicles with two occupants and a switchable FasTrak Flex toll tag set to the ‘2’ position to use the carpool lanes on the approaches to the Antioch, Benicia-Martinez, Carquinez, Dumbarton, Richmond-San Rafael and San Mateo-Hayward bridges. These two-occupant vehicles would not receive the 50 percent carpool discount but would be able to use the carpool lanes to save time traveling through the toll plazas. Use of the carpool lanes on approaches to the San Francisco-Oakland Bay Bridge still would require a minimum of three occupants.
The new carpool policy proposals are designed to improve safety on the toll bridge approaches by minimizing ‘weaving’ between lanes and to increase person-throughput by prioritizing access for buses and carpools. The policy change also would optimize lane configurations as now-obsolete toll booths are removed as part of the coming transition to open-road tolling.
Removing spalled on concrete on pier cap 305. Photo: CalTrans
BATA, which is directed by the same policy board as MTC, administers toll revenues from the Bay Area’s seven state-owned toll bridges. Toll revenues from the Golden Gate Bridge are administered by the Golden Gate Bridge, Highway and Transportation District, which joined with BATA to operate a single regional FasTrak customer service center in San Francisco. MTC is the transportation planning, financing and coordinating agency for the nine-county San Francisco Bay Area.
In response to a post of the link to this press release on X/Twitter on Wednesday, Nov. 30, State Senator Steve Glazer, who represents most of Contra Costa County, protested the proposed toll hikes writing, “Why was this need not identified and incorporated during the last toll increase in 2018? You don’t buy a boat and a new car when you don’t have the $ to fix the roof! A Thanksgiving/holiday season decision is a hide the ball strategy. Not good.”