


California’s Biggest Losers: Study reveals that Antioch’s citizens have NOT gained weight over the past decade.
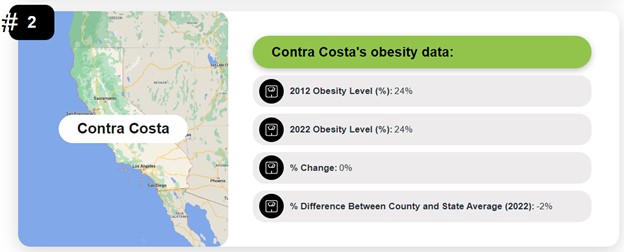
The table shows the obesity % changes in 2022 compared to 2012 in Contra Costa County.
-
San Francisco county’s citizens have lost the most weight over 10 years (they are 1% less obese).
-
Imperial county’s citizens have gained the most.
-
Infographic shows California’s biggest losers (of lbs).
 At the end of NBC’s first ‘The Biggest Loser’ season, the winning contestant had lost 122 pound (37% of his body weight). A study of contestants’ weight loss over a 6-year period after the show found that they had kept off 30% if their original bodyweight. Unfortunately, when it comes to America’s obesity crisis, life does not imitate reality TV. Warnings about America’s obesity epidemic are nothing new…
Statistics show that a sharp increase in obesity rates began in the 1980s, yet public health campaigns since have, it seems, not resulted in reductions in people’s waistlines. That is, according to a comprehensive study by BarBend.com, the world’s leading strength training resource and news outlet, who identified obesity levels over the past 10 years in counties across The Golden State.
The analysis of data available by County Health Rankings compared each county’s rate of obesity in 2012 to newly releases figures in 2022. The study found that of California’s 58 counties, just one has trended towards decreased levels of obesity (and six have remained the same) – this includes the good people of Antioch (Contra Costa County), who have not gained weight over the past decade. The other 51 counties have in fact, got fatter.
A closer look at the data…
The top 5 California counties that have fared best over the past 10 years:
1) San Francisco: 1% less obese.
2) Contra Costa: flat.
3) Sacramento: flat.
4) Santa Clara: flat.
5) Shasta: flat.
The bottom 5 California counties that have fared worst over the past 10 years:
54) Fresno: 9% more obese.
55) Santa Cruz: 9% more obese.
56) Monterey: 10% more obese.
57) Tehama: 10% more obese.
58) Imperial: 11% more obese.
Infographic showing obesity levels among California’s biggest cities and towns
If there was a silver lining to have come out of the research, it was that when compared nationally, California’s trend towards obesity is not as pronounced as in other states. In fact, Californians (albeit a minority) emerged as the 5th biggest losers (of lbs).
A look at the national figures…
The saying that ‘everything is bigger in Texas’ likely originated as a reference to the enormity of the state’s geographical area. However, it could also be applied to the state’s obesity levels. When analyzed nationally, four Texas counties occupy the bottom five for growth in obesity levels. These are:
3,139) Presidio (TX): 20% more obese than in 2012.
3,138) Pennington (SD): 19%
3,137) Hidaldo (TX): 18%
3,136) Starr (TX): 18%
3,135) Zavala (TX): 16%
The table shows the obesity % changes in 2022 compared to 2012 in Contra Costa County
Four out of the five biggest losers (those who have become less obese over the past decade) are in South Dakota (the only other being in Alaska):
1) Shannon (SD): 10% less obese than in 2012.
2) Prince of Wales-Outer Ketchikan (AK): 8%
3) Edmunds (SD): 5%
4) Hyde (SD): 5%
5) Roberts (SD): 5%
“The data clearly shows that, despite the warnings from public health officials, our lifestyles are becoming more sedentary and as a nation, we are becoming more obese,” says Max Whiteside of BarBend.com. “Obesity increases the risk of developing many diseases, and this is a crisis which is trending in the wrong direction.”
the attachments to this post:

scale graphic

obesity % changes in 2022 over 2012