


Proposed New Board of Supervisors District Maps Released

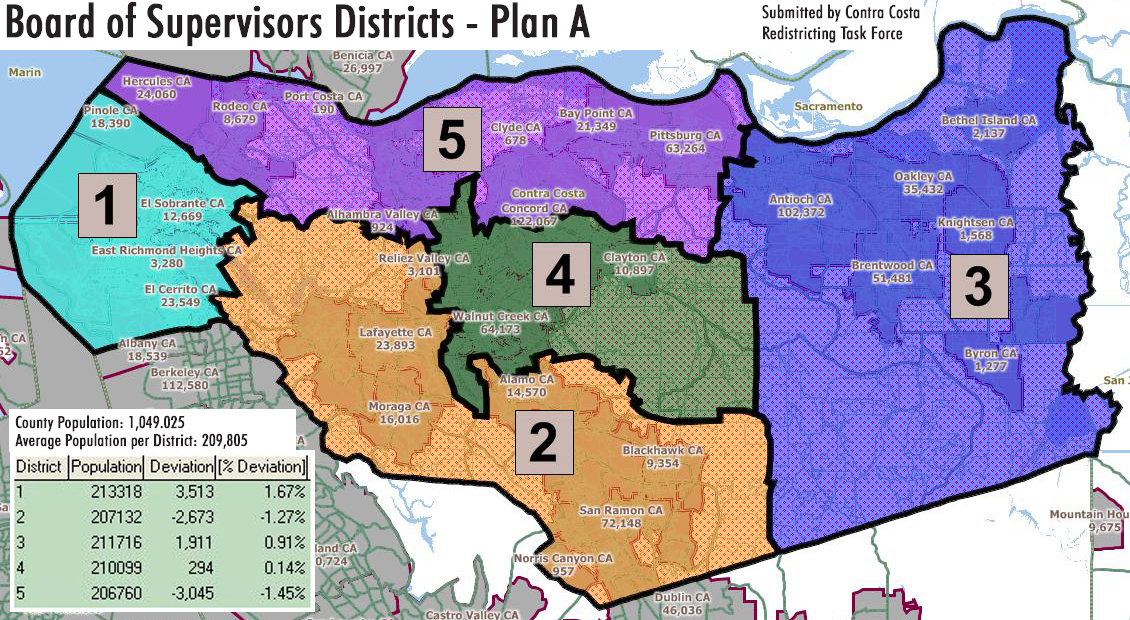
Proposed Board of Supervisors District Maps, Plan A by Contra Costa Redistricting Task Force
Issue on Board Agenda for Tuesday’s Meeting
By Allen Payton, Publisher
A team of county staff, led by Catherine Kutsuris, Director of the county’s Department of Conservation & Development and Patrick Roche, Principal Planner for the county, has produced four alternative maps and a citizens group (led by yours truly) has officially submitted two alternative maps for the new district lines for the Contra Costa County Board of Supervisors.
The first three of the staff’s maps, labeled Concepts 1 through 4, are similar to the current districts. Concept 4 is significantly different and is very much like the citizens’ group, labeled Plan B, which was given to staff at a meeting with them, last month. The group, known as the Contra Costa Redistricting Task Force, also submitted what is labeled as Plan A. The task force drew a total of eight different maps based on a list of principles (see below), which we developed from Supreme Court rulings, state Proposition 11, which was passed by voters in 2008 and created the California Citizens Redistricting Commission in charge of redrawing the state legislative and congressional district maps, as well as on common sense, such as geographic boundaries and common issues, and input from all five Supervisors.
The staff was given the following Principles/Criteria in their Adopted Work Program by the Board, in a unanimous vote on February 8, 2011 for creating the new district maps, which will go into effect next year:
♦ To the extent possible, achieve near equal population for each district according to census data. Total population for each district should be within 5% of each other.
♦ Use easily identifiable geographic features and topography to draw compact and contiguous adjusted boundaries.
♦ Maintain communities of interest in a single district and avoid splitting communities when adjusting boundaries. Communities of interest may be defined by existing boundaries for cities, school districts, special districts, and unincorporated communities.
The task force drew their lines based on the following principles, first and foremost being “Let the people choose their representatives and not the representatives choose their people;”
– Neutral, Non-Partisan Procedures
– Districts be Reasonably Equal in Population Size (within 1%)
– Contiguity of Districts
– Compactness of Districts – with the smallest perimeters, as possible
– Geographic Commonality
– Respect for Political Subdivisions (city and community boundaries)
– Common Issues – such as transportation, economic development, growth
While all of the staff’s plans meet their 5% population deviation goal, Concepts 1 through 3 violate their criteria of compactness as well as splitting cities and communities of interest.
The task force’s Plan A is the plan that splits only one community, Concord, since it’s the largest city in the county. All the other 18 cities remain whole, as do all the unincorporated communities, such as Alamo, Bay Point, Bethel Island and El Sobrante, plus the remaining “Census Designated Places” of which there are 53 in the county.
County staff have developed some webpages on the County’s website, which can be viewed at www.ccredistricting.org. They have uploaded the four maps and supporting information that they have created. But, as of the posting of this article, the task force’s maps aren’t on the website. However, they can be found in the Board’s May 3, 2011 agenda packet online by clicking here under item D3, “Public Comment-Contra Costa Redistricting Task Force.”
The task force’s two maps are also posted here for the public to review. Below are the population and community information for each plan.
Following Tuesday’s Board of Supervisors meeting, county staff will be holding public meetings in each of the five districts to seek public input on all the maps that have been submitted for the process. The dates, times and locations will be posted on their redistricting website.
——————————————————–
Contra Costa Redistricting Task Force
Contra Costa County Board of Supervisors Districts 2011
Plan A – Information
Changes from Plan B in Bold Blue
Census Designated Place Population District Total Deviation % Deviation
District 1
Richmond 103,701
North Richmond 3,717
East Richmond Heights 3,280
Kensington 5,077
El Cerrito 23,549
San Pablo 29,139
El Sobrante 12,669
Montalvin Manor 2,876
Tara Hills 5,126
Bayview 1,754
Rollingwood 2,969
Pinole 18,390
Other Non-CDP Areas 1,071
TOTAL District 1 213,318 +3,513 +1.67%
District 2
Lafayette 23,893
Orinda 17,643
Moraga 16,016
Acalanes Ridge 1,137
Reliez Valley 3,101
Alamo 14,570
Danville 42,039
San Ramon 72,148
Camino Tassajara 2,197
Blackhawk 9,354
Diablo 1,158
Norris Canyon 957
Non-CDP Areas 2,919
TOTAL District 2 207,132 -2,673 -1.27%
District 3
Discovery Bay 13,352
Brentwood 51,481
Antioch 102,372
Oakley 35,432
Bethel Island 2,137
Knightsen 1,568
Byron 1,277
Non-CDP Areas 4,097
TOTAL District 3 211,716 +1,911 +0.91%
District 4
Pleasant Hill 33,152
Pacheco 3,685
Walnut Creek 64,173
Clayton 10,897
Contra Costa Centre 5,364
North Gate 679
Shell Ridge 959
San Miguel 3,392
Castle Hill 1,299
Saranap 5,202
Concord 79,886
Non-CDP Areas 1,411
TOTAL District 4 210,099 +294 -0.14%
District 5
Pittsburg 63,246
Bay Point 21,349
Clyde 678
Martinez 35,824
Vine Hill 3,761
Mountain View 2,372
Alhambra Valley 924
Port Costa 190
Rodeo 8,679
Crockett 3,094
Hercules 24,060
Concord 42,181
Non-CDP Areas 3,496
TOTAL District 5 206,760 -3,045 -1.45%
TOTAL County 1,049,025
Average Population Per District 209,805

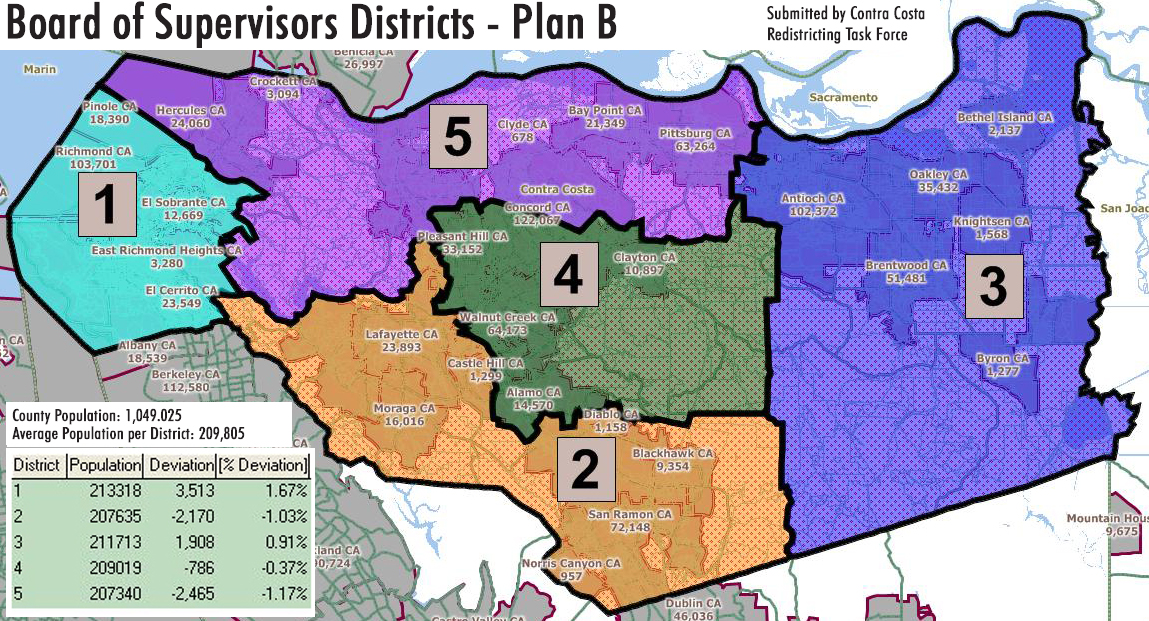
Proposed Board of Supervisors District Maps, Plan B by Contra Costa Redistricting Task Force
Plan B – Information
Changes from Plan A in Bold Red
Census Designated Place Population District TTL Deviation % Deviation
District 1
Richmond 103,701
North Richmond 3,717
East Richmond Heights 3,280
Kensington 5,077
El Cerrito 23,549
San Pablo 29,139
El Sobrante 12,669
Montalvin Manor 2,876
Tara Hills 5,126
Bayview 1,754
Rollingwood 2,969
Pinole 18,390
Non-CDP Areas 1,071
TOTAL District 1 213,318 +3,513 +1.674%
District 2
Lafayette 23,893
Orinda 17,643
Moraga 16,016
Acalanes Ridge 1,137
Reliez Valley 3,101
Danville 42,039
San Ramon 72,148
Camino Tassajara 2,197
Blackhawk 9,354
Diablo 1,158
Norris Canyon 957
Castle Hill 1,299
Saranap 5,202
Walnut Creek (Rossmoor) 10,150
Non-CDP Areas 1,341
TOTAL District 2 207,635 -2,170 -1.034%
District 3
Discovery Bay 13,352
Brentwood 51,481
Antioch 102,372
Oakley 35,432
Bethel Island 2,137
Knightsen 1,568
Byron 1,277
Non-CDP Areas 3,198
TOTAL District 3 211,713 +1,908 +0.909%
District 4
Pleasant Hill 33,152
Walnut Creek 54,023
Clayton 10,897
Contra Costa Centre 5,364
North Gate 679
Shell Ridge 959
San Miguel 3,392
Alamo 14,570
Concord 83,389
Non-CDP Areas 2,594
TOTAL District 4 209,019 –786 -0.375%
District 5
Pittsburg 63,246
Bay Point 21,349
Clyde 678
Martinez 35,824
Vine Hill 3,761
Mountain View 2,372
Alhambra Valley 924
Port Costa 190
Rodeo 8,679
Crockett 3,094
Hercules 24,060
Pacheco 3,685
Concord 38,678
Non-CDP Areas 2,166
TOTAL District 5 207,340 -2,465 -1.175%
TOTAL County 1,049,025
Average Population Per District 209,805
the attachments to this post:
CCRTF CCCBOS Plan B with pop #’s
CCRTF CCCBOS Plan A with pop #’s
CCRTF CCCBOS Plan A Final